Load Shedding with NGINX using adaptive concurrency control — Part 1

Author’s Note: This is a two-part series about how we implemented and operationalized load shedding in our services using adaptive concurrency control with NGINX. Part 1 sets the context/background and part 2 focusses on the implementation.
I wrote about this technique in much detail last year (Part 1, 2, 3, and 4). Some of the content here is adopted from these posts. Although I have tried to make this post self-sufficient, if you want further deep-dive on this topic, I’d recommend going through the other four posts and their attached reference material.
Primer
When we talk about resilience in a microservice architecture, it’s highly likely that circuit breaking will come up. Popularised by Michael Nygard in his excellent book Release It! and Netflix’s Hystrix library, it has, perhaps, become the most discussed technique for making services more resilient when calling other services. Though there are many different implementations of circuit breakers, the one most popular is akin to client-side throttling — when a caller (client) of a service detects degradation in responses from the service i.e. errors or increased latencies, it throttles the calls to the service until it recovers. This is more about being a good citizen — if the service you are calling is degraded, sending more requests will only make it worse, so it’s better to give it some time to recover.
Much has been written (in blogs and books alike) about circuit breakers, but the other side of it, that is — protecting your own services from overload, doesn’t get as much attention, in my humble opinion. When your service starts to degrade, how can you prevent it from slipping into an overloaded and completely unusable state (at worst, requiring manual intervention to resurrect it) caused by callers (users, other services) that keep sending requests unbeknownst to its plight, is a critical and more important question to ask.
This degradation usually happens because of resource saturation (CPU, memory, IO, network, etc.) or something like prolonged GC pauses in either the service itself or its dependencies. The saturation can be:
- Negative: Incoming traffic remains normal, but the service or its dependencies (database, cache) are experiencing saturation (CPU/memory/IO pressure, long GC pause)
- Positive: Service and its dependencies are normal, but the traffic suddenly increases and causes saturation
The end result is that the service will not be able to process requests in a timely manner, and if there are no safeguards in place, the issue propagates to dependant services causing cascading failures. Raise your hand if you have seen this — PagerDuty alert fires for multiple services/systems at once when there is an issue with a service.
Right now, you must be thinking about autoscaling. It has its place but falls short in handling overload situations on its own. Autoscaling works best when there is a gradual increase in incoming traffic. It usually can’t react fast enough when there is a sudden increase in traffic.
Load Shedding
One effective technique for managing overload is load shedding (akin to server-side throttling). Instead of trying to accept and process every single request, just accept what you can process in a timely manner and reject the excess requests. The key idea here is graceful degradation — when degraded, it’s better to stay up and do some useful work rather than crumble under pressure trying to do all the work.
Load and Queuing
Every request processing system has a finite capacity (which itself varies from time to time depending on various factors). When incoming work exceeds this capacity, the system has a choice —either reject it or accept it and put it in a queue to process later. If requests are queued, the queue is unbounded or has a very large size, and the request arrival rate remains constantly high, the queue will keep growing, which has 2 adverse effects:
- The queue will consume resources (e.g., memory), potentially further slowing down the processing of active requests
- The callers will experience increasingly high latencies since, for callers,
latency = time waiting in queue + processing time. As this latency increases, callers will potentially timeout and retry, further exacerbating the problem.
To protect against this, we need to control the queuing. Some queuing is still desirable as it allows us to handle small bursts, but excessive queuing should be avoided.
Queuing in Tomcat
Let’s illustrate the effects of queuing using a Spring Boot application with embedded Tomcat server. We can define the maximum number of worker threads using server.tomcat.max-threads (default 200). It defines the maximum number of requests that can be processed concurrently. Excess requests will be queued. Queue size is defined by server.tomcat.max-connections (default 10000 for NIO connector and 8192 for APR). There is also a queue at the OS level where connections wait if Tomcat queue is full. This is defined by server.tomcat.accept-count (default 100).

We can easily simulate queuing by creating a simple GET endpoint that sleeps for 1 second before returning a 200 OK response. I set the max-threads property to 10 and created a simple Node.js script to send a constant flow of N requests per second.
If N < 10, there should be no queuing. Here’s the result:
Indeed, there is no queuing, and response time hangs around 1 second. All good.
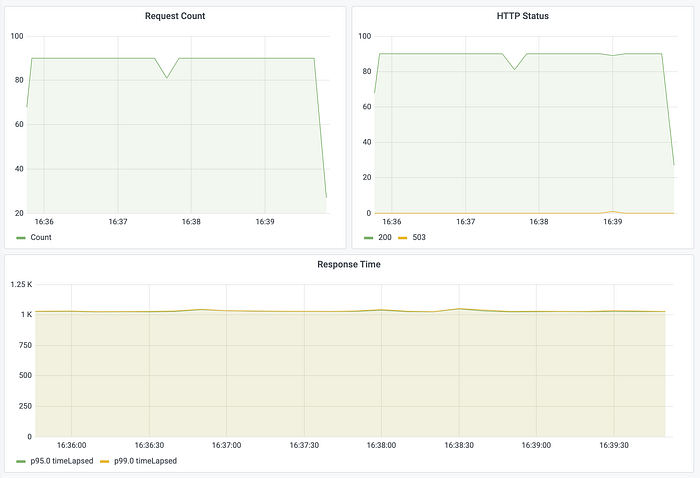
However, if N > 10, we should see the effects of queuing. Here’s the result with N = 12:

We can see the response time increasing monotonically, but no errors. This is because requests spend increasingly more time in the queue.
Load Shedding By Limiting Concurrency
One effective technique for load shedding is concurrency control— limit the number of concurrent requests. In this context, concurrency is defined as the number of requests that have been accepted for processing at any point in time, also known as In-flight Requests (IFR). This essentially is the sum of requests being worked on right now and requests waiting in queue.
For example, in case of the Spring Boot application, we can limit concurrency to, say, 250 using the following configuration:
server.tomcat.max-threads=200
server.tomcat.max-connections=50
This allows for 200 requests to be processed concurrently by worker threads and a maximum of 50 requests being queued if all worker threads are busy. When the queue is full, excess requests will be rejected.
Another technique is rate-limiting — as in, limiting requests per second. Rate-limiting is useful in certain scenarios like rate-limiting on a per-client basis to protect from a single malicious client. It’s not, however, very effective as a load-shedding mechanism to protect services from overload. Rate-limiting could work in an ideal scenario where request processing time for all requests is steady at all times, which couldn’t be far from reality. When service degrades, rate-limiting mechanism can send more requests than the service is capable of handling, causing overload. If you wish to know more, I recommend this amazing video: Stop Rate Limiting! Capacity Management Done Right by Jon Moore. You can read more here and here.
Adaptive Concurrency Control
Although the static concurrency limiting approach is better than nothing or rate-limiting, it still suffers from a problem — it can be hard to pick the right concurrency. If it’s low, there will be unnecessary throttling. If it’s high, the efficacy of the whole mechanism will be reduced. Since service health and performance are dynamic and keep changing, it can be very hard to pick a reasonable limit.
Enter adaptive concurrency control — adjust the concurrency limit dynamically by constantly observing the state of the service.
Adaptive concurrency control is a type of closed-loop feedback control system as depicted in the diagram below (think thermostat or air conditioner):
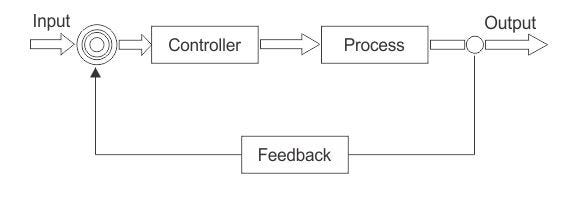
It treats the service as a black-box, observes the output (response time), and periodically adjusts the concurrency limit to keep output within acceptable limits.
The first implementation of this technique that I came across was Netflix’s concurrency limits library (and the associated blog post). It’s a java-based library that can integrate with GRPC or servlet-based applications. It implements multiple algorithms based on TCP congestion control mechanisms. Some of the algorithms are:
- Additive Increase Multiplicative Decrease (AIMD), based on this
- Gradient
- Vegas, based on this
I have done a detailed breakdown of these algorithms from the library’s implementation here.
Although this library is great for its implementation of these algorithms, it has a severe drawback — it has to be integrated within the application and does not have visibility into the webserver queue which, as we saw earlier, is the main culprit. I have done a detailed analysis on why this library falls short of its intended purpose and why the concurrency limiting logic should be in the proxy fronting the application that can measure processing as well as queuing delays.
Since we, at OLX Autos, are using NGINX as a reverse proxy sidecar with most of our services, it seemed like the right place for us to have the concurrency control mechanism. Unfortunately, I couldn’t find any such implementation. So I decided to take the algorithms from the concurrency limits library and implement them on top of NGINX so that we could use them with our services which I’ll explore in the next part of the series.
A Case Study
Before we move on to the next part, I would like to share an interesting case study of overload using an outage we had where load shedding would have been useful.
Intro
We deploy our services in Kubernetes. Our traffic patterns are quite predictable — high during the day and very low at night. We use autoscaling for most of our services using Horizontal Pod Autoscaler (HPA) to save cost. The relevant section of the architecture looks like this:

Service A receives traffic from users. It calls service B to fetch results from our SolrCloud cluster. A single request to service A results in multiple requests to service B (on average, ~2.5). Service A then aggregates and sorts the results before returning them back to the users.
The focus of this case study is service B. It had autoscaling set up with CPU usage as the scaling metric, minimum replicas 5, and maximum replicas 80.
The Incident…with a dash of drama
It was the peak traffic time. Service B was running at full throttle with maximum (i.e. 80) replicas. Because of some issue in service A, it stopped sending requests to service B. No traffic, no CPU usage. HPA kicked in and quickly killed the pods, bringing the count to the absolute minimum (i.e. 5). When the issue in service A was resolved, it unleashed all of the peak-time traffic on service B. Five pods received the traffic that would normally be served by eighty. They crashed immediately and violently. Any new pods that dared to rise met with the same fate. Eventually, we had to stop all the traffic and manually scale the replicas before allowing the traffic back in.
What Could Have Been
If we had load shedding in service B, the five pods could have stayed up, doing their part and rejecting the rest of the excess requests. It would have given HPA time to gradually spin up more replicas. Initially, there would have been a lot of 503 responses which would have gradually decreased as more replicas came up. (There is also an interesting learning here about autoscaling configuration and things like cooldown/delay, but that’s for another day).
In the next part, I describe our journey of implementing adaptive concurrency control in NGINX and operationalizing it with our services.
Further Reading
- https://landing.google.com/sre/workbook/chapters/managing-load
- https://www.evanjones.ca/prevent-server-overload.html
- Load shedding lessons from Google: https://www.youtube.com/watch?v=XNEIkivvaV4
- https://blog.acolyer.org/2018/11/16/overload-control-for-scaling-wechat-microservices
- https://medium.com/@NetflixTechBlog/performance-under-load-3e6fa9a60581
- https://aws.amazon.com/builders-library/using-load-shedding-to-avoid-overload
- https://cloud.google.com/blog/products/gcp/using-load-shedding-to-survive-a-success-disaster-cre-life-lessons
- https://ferd.ca/handling-overload.html
- https://www.infoq.com/articles/anatomy-cascading-failure
- https://www.datadoghq.com/videos/the-anatomy-of-a-cascading-failure-n26